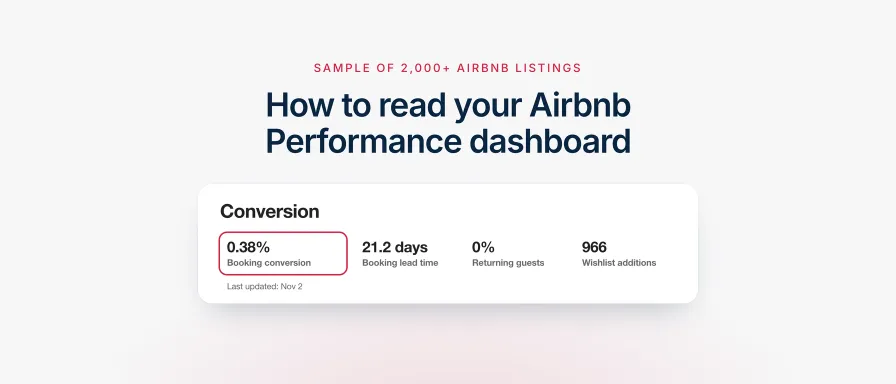
Airbnb conversion rate is one of the most useful guiding metrics you have, and one of the easiest to misread. It can fall while more guests are seeing your listing. It can look excellent when few guests see you at all. And significant time needs to pass before a change you make shows up in the dashboard.
This guide explains every metric on the Airbnb Performance dashboard, shows what a good Airbnb conversion rate looks like, and tells you which metric to check after each change you make. The benchmarks come from almost a year of daily dashboard data from a sample of more than 2,000 active Airbnb listings in Homesberg’s data.
What the Airbnb Performance Dashboard (Insights) Shows and Where to Find It
The Performance dashboard is Airbnb’s report card for your listings.
Where to find it: in the Airbnb app or on desktop, tap Switch to hosting, open the menu and select Insights. That is where the Performance dashboard lives on both.
The main page is made up of five blocks:
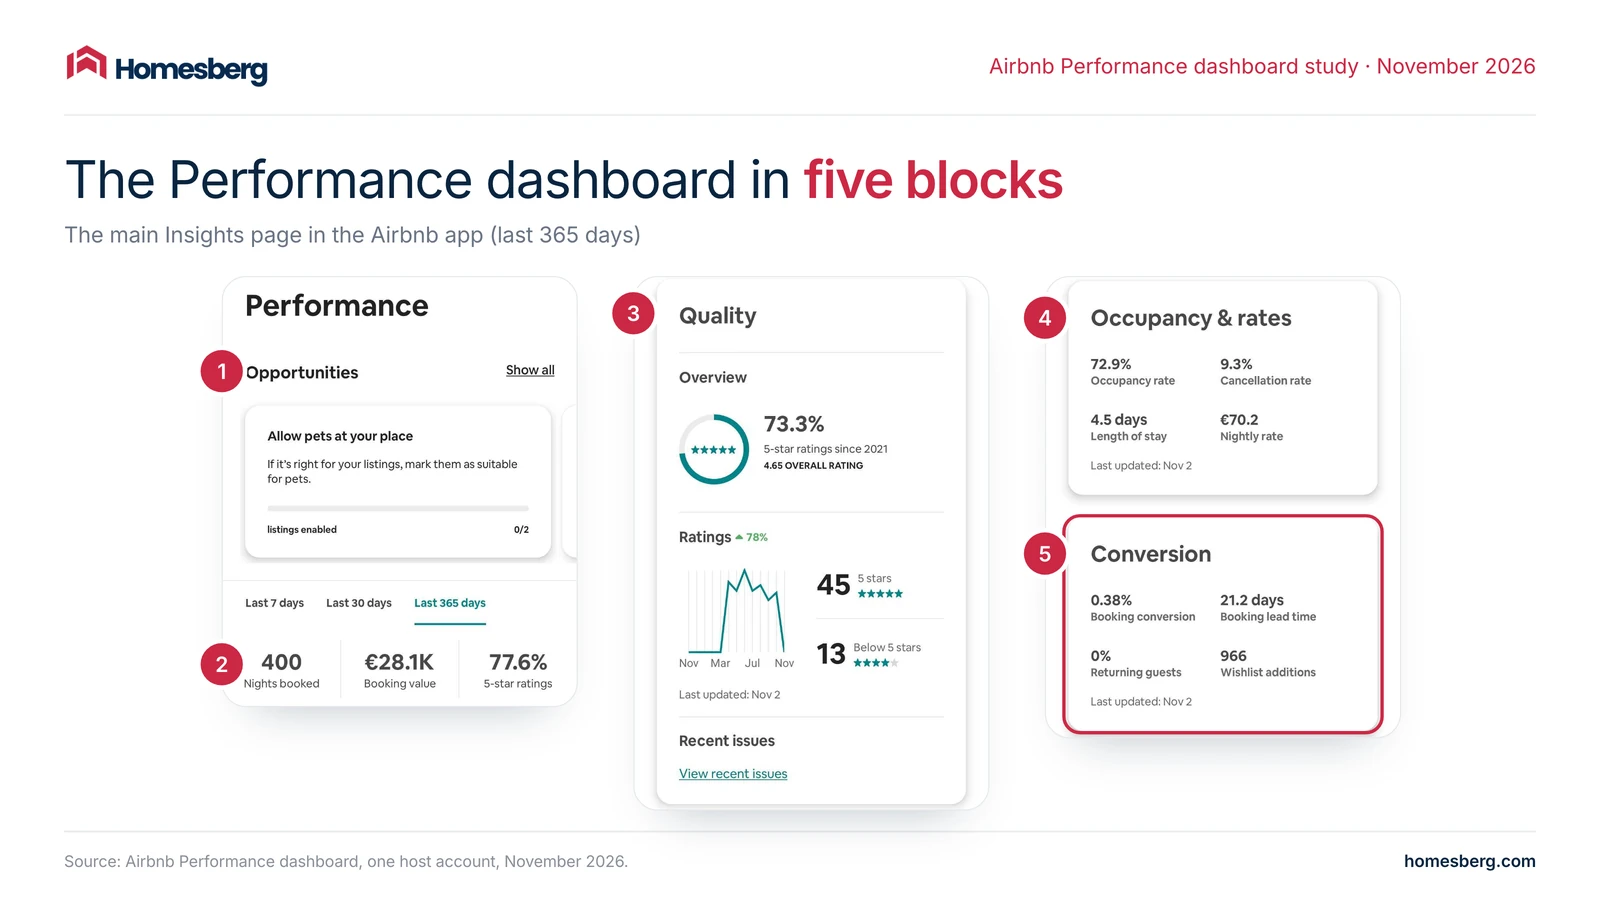
- Opportunities: suggestions from Airbnb, such as allowing pets.
- Summary: nights booked, booking value and your share of 5-star ratings for the last 7, 30 or 365 days.
- Quality: your rating overview and recent guest issues.
- Occupancy & rates: occupancy, cancellation rate, length of stay and nightly rate.
- Conversion: booking conversion, booking lead time, returning guests and wishlist additions.
Tap Conversion to open the full Conversion tab. This is where most of the useful detail lives.
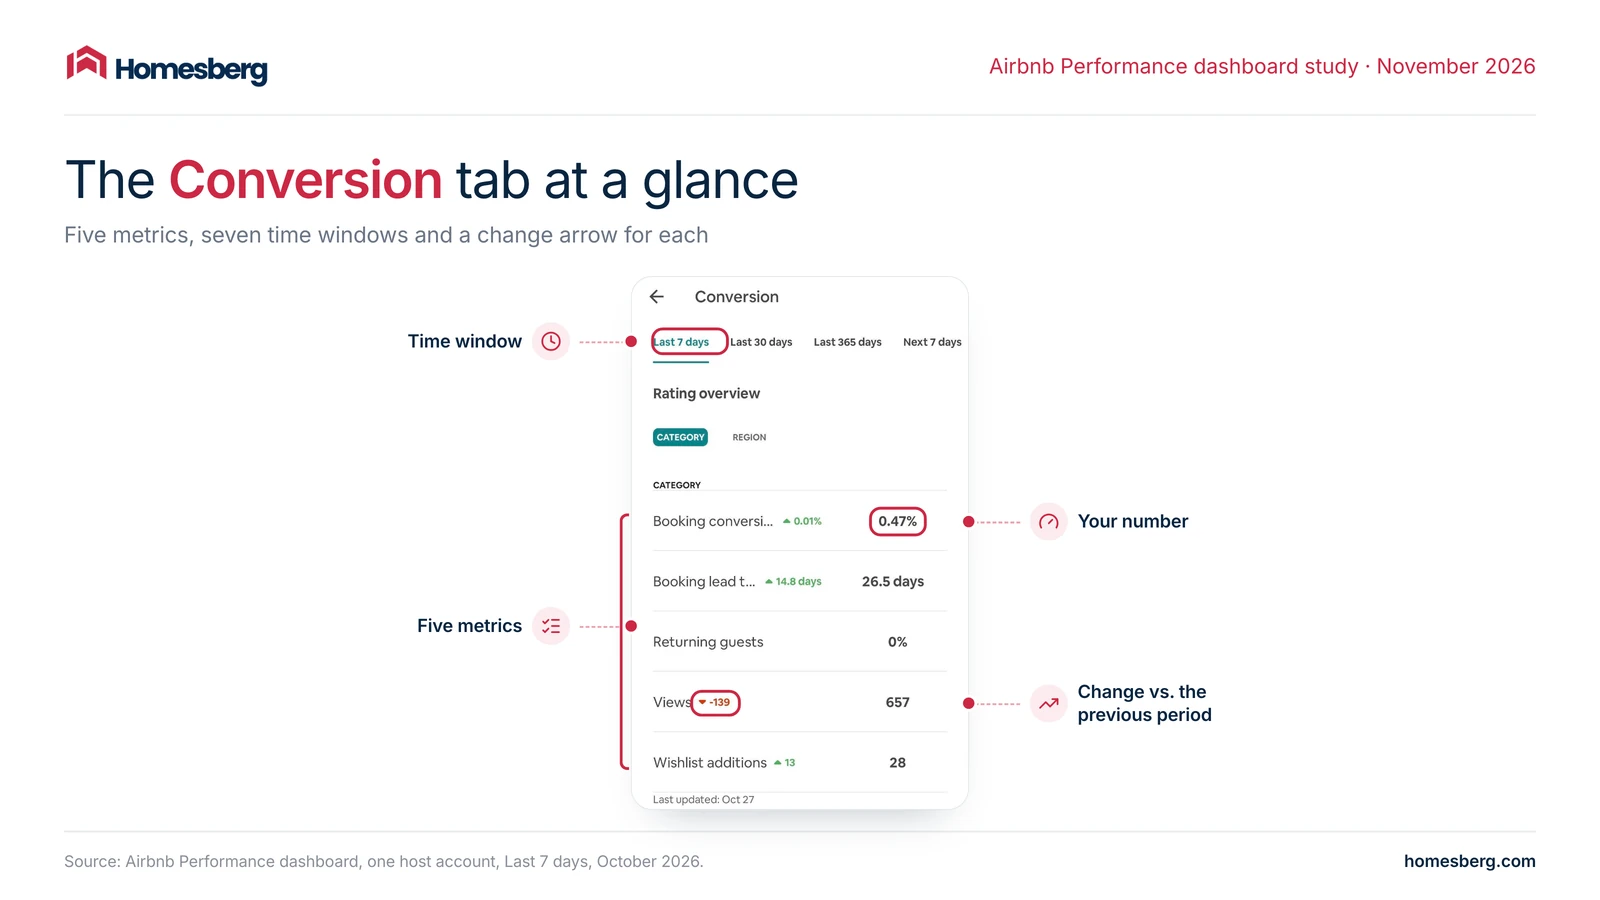
Here is what each metric means:
- Booking conversion: the share of guests who saw your listing in search and went on to book.
- Booking lead time: the average number of days between booking and check-in.
- Returning guests: the share of bookings from guests who stayed with you before.
- Views: how many times guests opened your listing page.
- Wishlist additions: how many times guests saved your listing to a wishlist.
Each metric shows your number for the chosen time window, with a small green or red arrow under it. One detail trips up many hosts: those arrows are comparisons, not trends. In the past windows, each arrow compares with the period before. In the “Next” windows, it compares with the past window of the same length, so Next 30 days is set against Last 30 days.
On desktop, you get more detail compared to the mobile app. The Conversion section splits into five pages: Booking conversion, Booking lead time, Returning guests, Views and Wishlist additions. The Booking conversion page breaks your rate into its steps: first-page search impression rate, search-to-listing conversion and listing-to-booking conversion. The Views page shows page views next to first-page search impressions.
Every desktop page also lets you pick a date range, filter by rooms and beds, region or amenities, and compare Over time or against Similar listings. A table at the bottom shows each listing’s own number, so you can spot which listing is dragging the average down. The next section shows how the steps fit together.
The Booking Funnel: How Airbnb Calculates Your Conversion Rate
Every guest who books your place passes through four steps, and Airbnb reports a rate between each one.
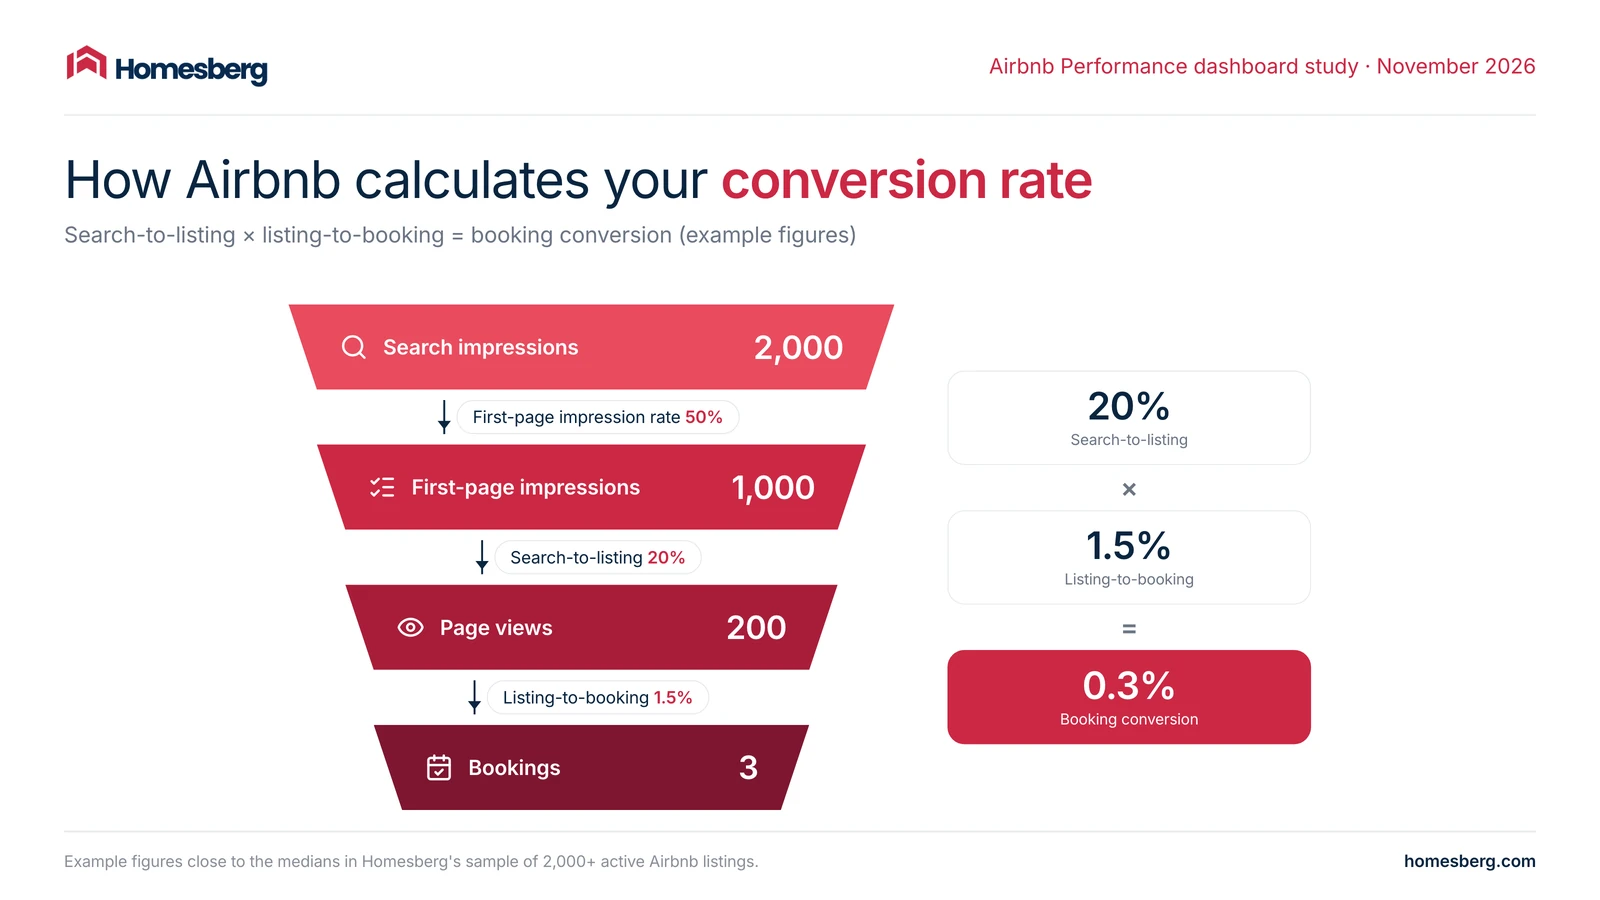
- Search impressions: your listing appears in search results.
- First-page impressions: it appears on page one. The share of your impressions that land there is your first-page impression rate.
- Page views: a guest opens your listing. Page views ÷ first-page impressions = search-to-listing conversion.
- Bookings: the guest books. Bookings ÷ page views = listing-to-booking conversion.
Booking conversion, the headline Airbnb conversion rate (desktop version calls it the “overall conversion rate”), is simply the two rates multiplied: search-to-listing × listing-to-booking. In the example above, 2,000 search impressions become 1,000 first-page impressions, 200 page views and 3 bookings: 20% × 1.5% = 0.3% booking conversion. In our data, that multiplication held in 99.8% of daily snapshots. Across these listings, every 1,000 first-page impressions turned into about 171 page views.
Each step has its own lever. Rank decides how often you reach page one. Your search card (cover photo, title, price and rating) decides whether guests click. Your listing page (photos, description, total price and reviews) decides whether they book.
When booking conversion falls, one of the two steps fell. Check which one before you change anything, because a weak search card and a weak listing page need different fixes.
Airbnb Search Impressions and First-Page Impression Rate
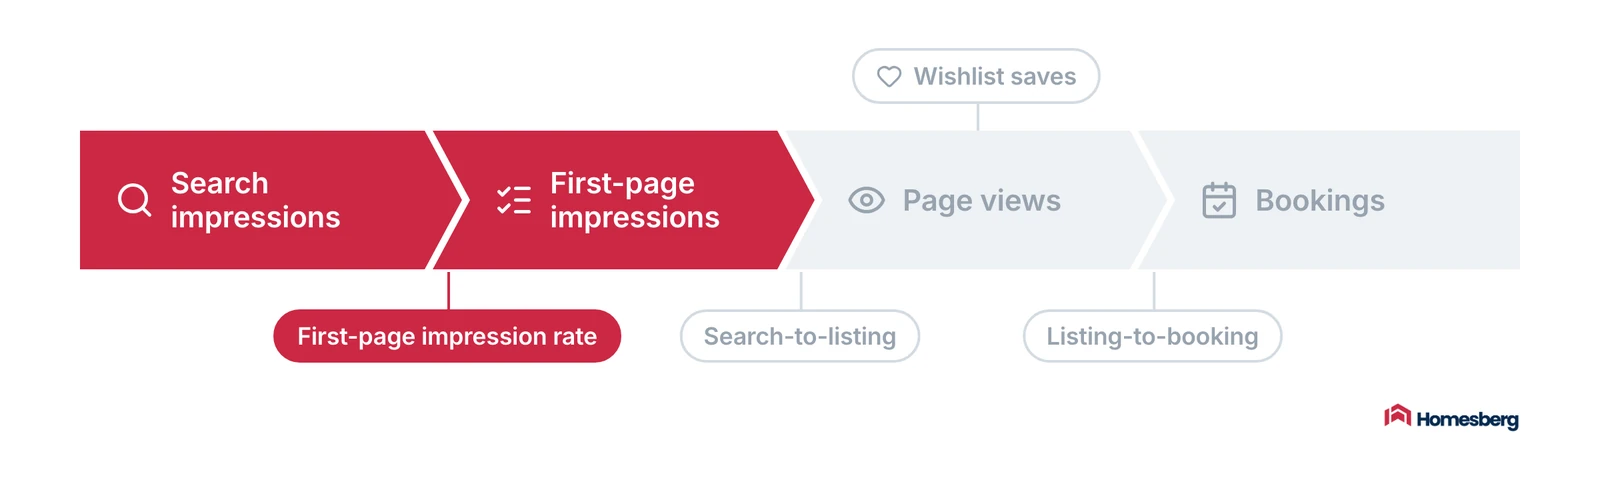
First-page search impressions count how often your listing appeared on page one of Airbnb search. First-page impression rate is the share of all your impressions that happened there.
Page one matters because most guests never scroll far. An impression on page three is a guest who probably never noticed you.
Benchmark: for the median listing, half of its impressions were on page one. The middle half of listings sat between 44% and 57%.
What moves it:
- Your price against similar listings for the same dates
- Availability and booking settings, such as minimum stay and Instant Book
- Reviews and ratings
- Past conversion, because Airbnb ranks listings by how likely they are to be booked (more in our guide to how the Airbnb algorithm works)
Price is the fastest lever. After a base price cut, the first-page impression rate in our data rose by about 2 percentage points within two weeks, net of market-wide changes.
Airbnb Page Views (Listing Views)
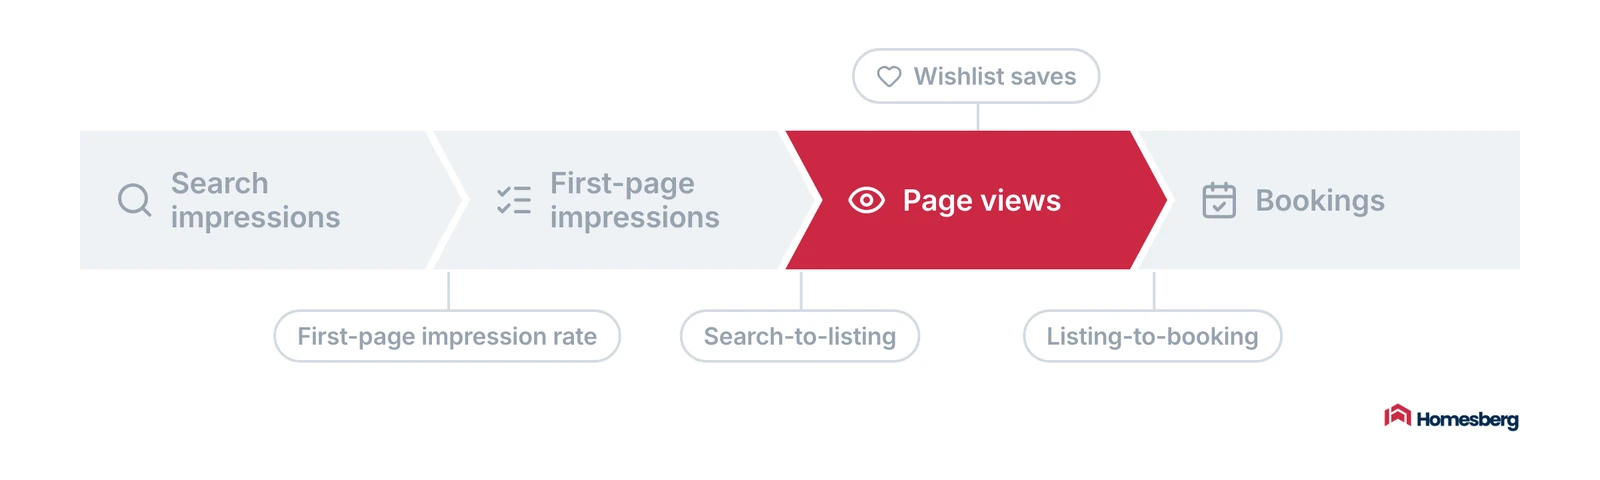
Page views, shown as Views on the dashboard, count how many times guests opened your listing page. They are the volume in the middle of the funnel, and they react quickly when your visibility changes.
Benchmark: in the next-90-day view, the median active listing had 580 page views and 2,303 first-page impressions.
If page views drop, look one step up first. Did impressions fall? That is a visibility problem. Did impressions hold while views fell? Then fewer guests are clicking, and the search card is the place to look.
Search-to-Listing Conversion Rate
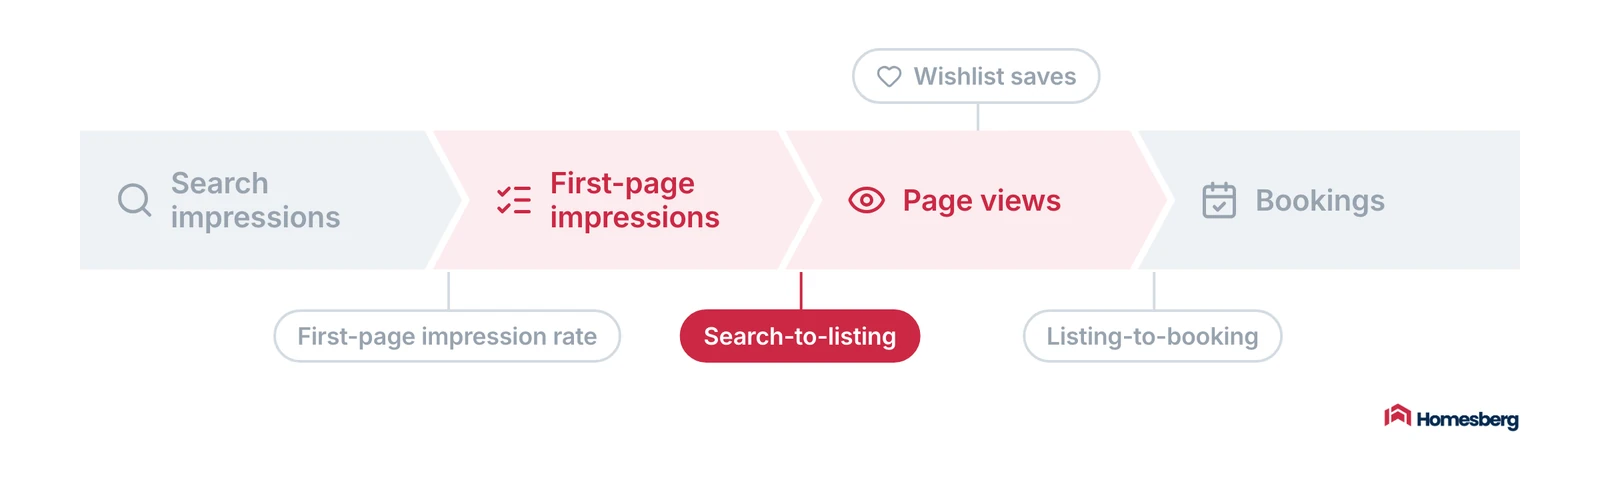
Search-to-listing conversion is page views ÷ first-page impressions, capped at 100%. It tells you whether your search card earns the click. At this point, a guest has seen only your cover photo, title, price, rating and review count.
Benchmark: the median listing converted 19.5% of first-page impressions into page views. The middle half ranged from 12% to 37%.
Watch out: the denominator is first-page impressions only. A listing that mostly shows up on page two still collects page views, so its rate can look excellent while its reach is weak. Always read this rate next to your first-page impressions.
If it is low:
- Cover photo: it decides more clicks than anything else. Use your brightest, most distinctive shot.
- Displayed price: if your total looks high next to the listings around it, guests scroll past.
- Rating and review count: a thin review history makes your card look riskier than the alternatives.
- Title: its effect is limited. Use all 50 characters, and put the most specific detail first, because phones show only about the first 36.
Listing-to-Booking Conversion Rate
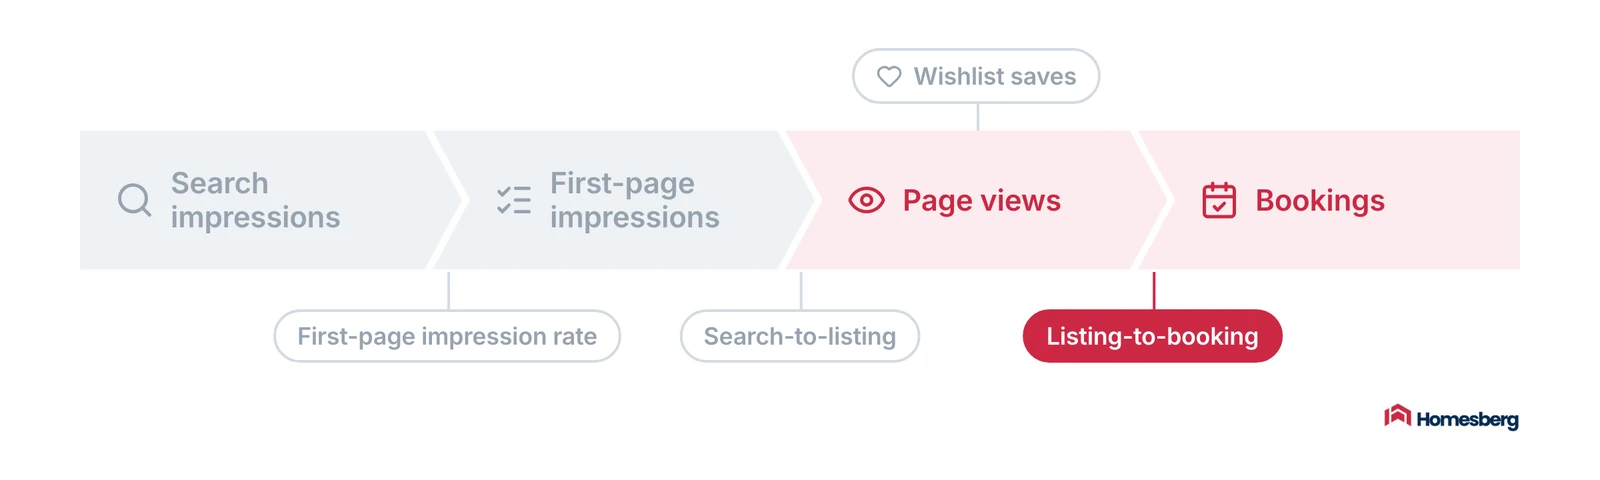
Listing-to-booking conversion is bookings ÷ page views. The guest has clicked, and now your listing page has to close the deal.
Benchmark: the median listing converted 1.6% of page views into bookings. The top quarter converted 3.1% or more.
This is the step that separates strong listings from weak ones. When we split the difference in booking conversion between listings into its two steps, listing-to-booking explained 84% of it and search-to-listing 29%. The two overlap slightly, so the shares add up to more than 100%. If you can only work on one thing, work on the listing page.
If it is low:
- Photos: guests may not see enough of the space, or the photos may not match the cover image.
- Description and amenities: missing details create doubt, and doubtful guests book elsewhere.
- Recent reviews: guests read the latest ones closely at this stage.
- Booking friction: request-to-book listings lose guests who would have booked instantly elsewhere.
Your market’s booking habits matter too. Listings whose guests book about 20 days ahead converted 4.2% of views into bookings, against 2.2% for listings whose guests book about 2 days ahead (last-7-day view). If your guests book last minute, compare yourself with similar markets before assuming something is wrong.
What Is a Good Airbnb Conversion Rate?
Airbnb does not publish a benchmark. Here is where the active listings in our study landed, using each listing’s average over almost a year in the next-90-day view:
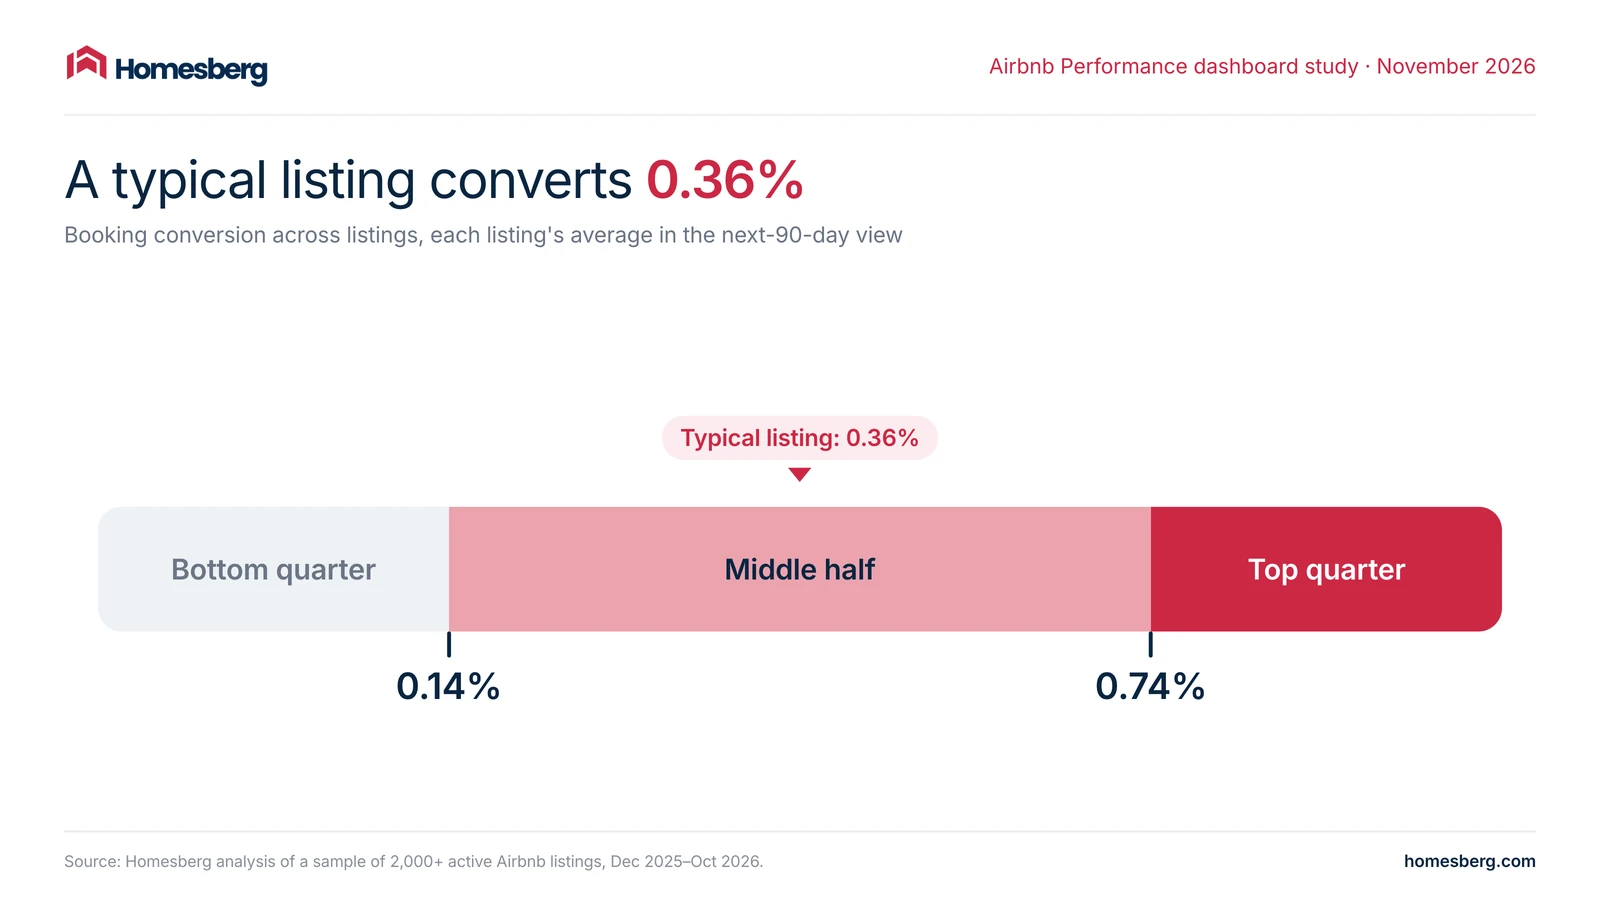
The typical listing turned 0.36% of its first-page impressions into bookings, and the top 10% reached 1.64% or more. The benchmarks for the two steps are in their sections above. They don’t multiply into 0.36%, because the listing with a typical click rate is rarely the one with a typical booking rate.
Two caveats before you compare yourself:
- A high rate can hide low reach. The quarter of listings with the highest booking conversion had the fewest first-page impressions of any group (1,233, against 4,511 for the second quarter), and booked about as many nights as the quarter below them. With a small denominator, a high rate is easy.
- Seasons move the rate. From June to July, the same listings’ first-page impressions rose about 30% while their booked nights for the next 90 days stayed flat, so booking conversion fell about 20%. More guests looked, and the same number booked. A July dip does not mean your listing got worse.
The fairest comparison is your own history in the same time window. The second fairest is your direct competition, and the dashboard can show you that too.
How to Compare Your Airbnb Listing With Similar Listings

On desktop, open any Conversion page in Insights and switch Compare from Over time to Similar listings. Airbnb plots your weekly rate next to theirs and sums up the gap in one line. It picks similar listings by location, size, features, amenities, ratings, reviews and the other listings guests browse while considering yours. That makes them your direct competition, and a better yardstick than any market-wide average, ours included.
Two things to watch when you read it:
- The gap is in percentage points. In one host account we looked at, Airbnb said the rate was “0.27% higher than similar listings”. That was 0.50% against 0.23%: more than double. A gap that sounds tiny can be large.
- The latest week has only just started. It rests on a handful of views, so one booking can swing it far up or down. Judge the trend over four or more full weeks.
Here is what the comparison usually means:
- You and similar listings fell together: the market moved, most often with the season. Compare with the same weeks last year before you change anything.
- You fell and they did not: something on your side changed. Look at what you changed in the last few weeks: price, photos, availability, or a new review.
- You trail them on search-to-listing: guests see you in search and pick someone else. Your cover photo, title or the price shown in search is losing to theirs.
- You trail them on listing-to-booking: guests open your page and leave. Check the total price with fees, your photos and your latest reviews.
- You beat them on conversion but trail on first-page impressions: guests who find you book, but too few find you. That is a visibility problem, and price and rank are the levers (more on that below).
Compare prices, too. In your Calendar, select one or more nights, click the nightly price, then View similar listings. You see what guests paid on average for similar listings (booked prices) and what similar listings still open for those dates are asking (available prices). If your price sits above what guests have been paying for similar places, expect fewer page views and saves. The view does not appear when Smart Pricing is on or when too few listings compare, and it compares nightly prices only, not totals with cleaning fees. To compare with the listings you are actually up against, Homesberg’s rank tracker shows who is on page one for your dates and what they charge.
In short: compare with yourself to see the trend, and with similar listings to see the cause.
Airbnb Wishlist Saves
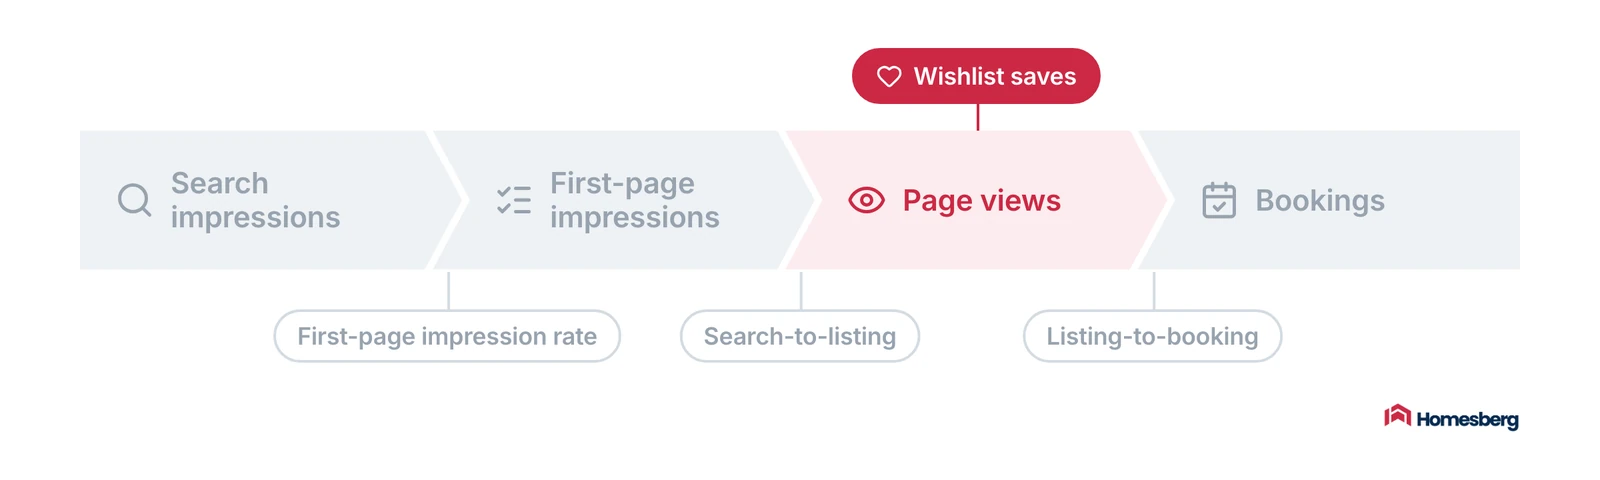
Wishlist additions count how often guests saved your listing. A save is not a booking, but it is the earliest sign of demand the dashboard gives you.
Benchmark: the median listing gets about 5 to 6 saves a week. The middle half sits between about 3 and 10.
Saves predict bookings. We compared each listing’s weeks with its own other weeks, adjusted for seasonal swings that hit every listing. Weeks with the most saves were followed by about 40% more bookings over the next two weeks than weeks with the fewest. The link held even after accounting for the bookings the listing was already getting that week.
Saves react to price within a week or two, which makes them one of the quickest ways to judge a price change (more below).
One quirk: in the dashboard’s upcoming windows (Next 7 to 180 days), wishlist additions show 0. Saves only count in past windows, so a red arrow there is not a drop in demand.
How Price Changes Move Your Dashboard Metrics

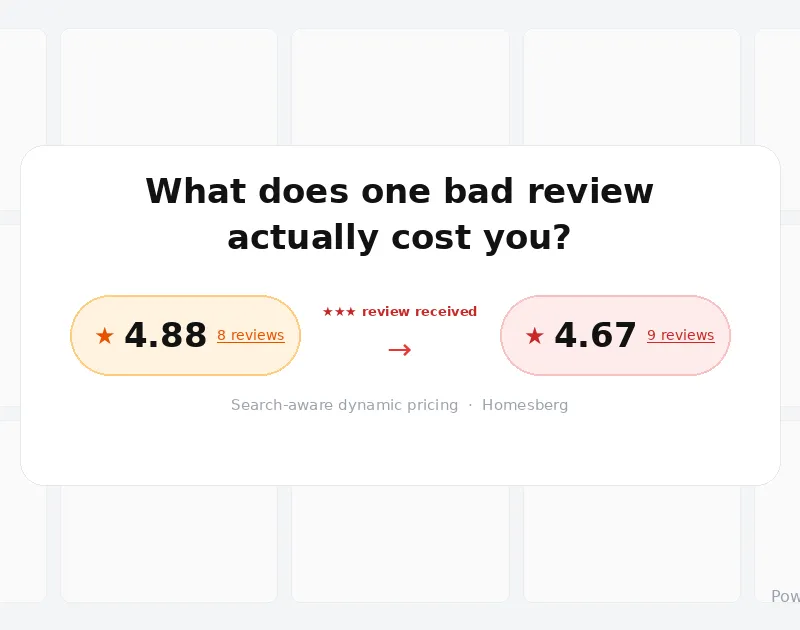
That is how a price cut shows up on your dashboard. It does not make each guest more likely to book. It brings more guests, and the same share of a bigger crowd adds up to more bookings.
We followed the listings in our sample week by week from February to October 2026, the months for which we also tracked their search results. For each week with a price change, we compared the listing’s dashboard with its own weeks where the price held steady, after removing swings that hit every listing at once. After a price cut of more than 10%, page views rose about 13% within two weeks and wishlist saves rose by about a third, while booking conversion stayed at each listing’s usual level. A rise of more than 10% did the opposite: page views fell about 9% and saves fell by about a fifth.
A steady conversion rate after a price cut is good news, not a sign the cut failed. Look for the effect in page views and wishlist saves in the first one or two weeks. The same logic runs in reverse: a steady rate after a price rise means the same share is booking from a smaller crowd.
Booked nights rose after cuts as well, but they had often dipped just before the cut, so bookings alone can’t tell you how much of that rise came from the price.
How Search Ranking Changes Move Your Dashboard Metrics
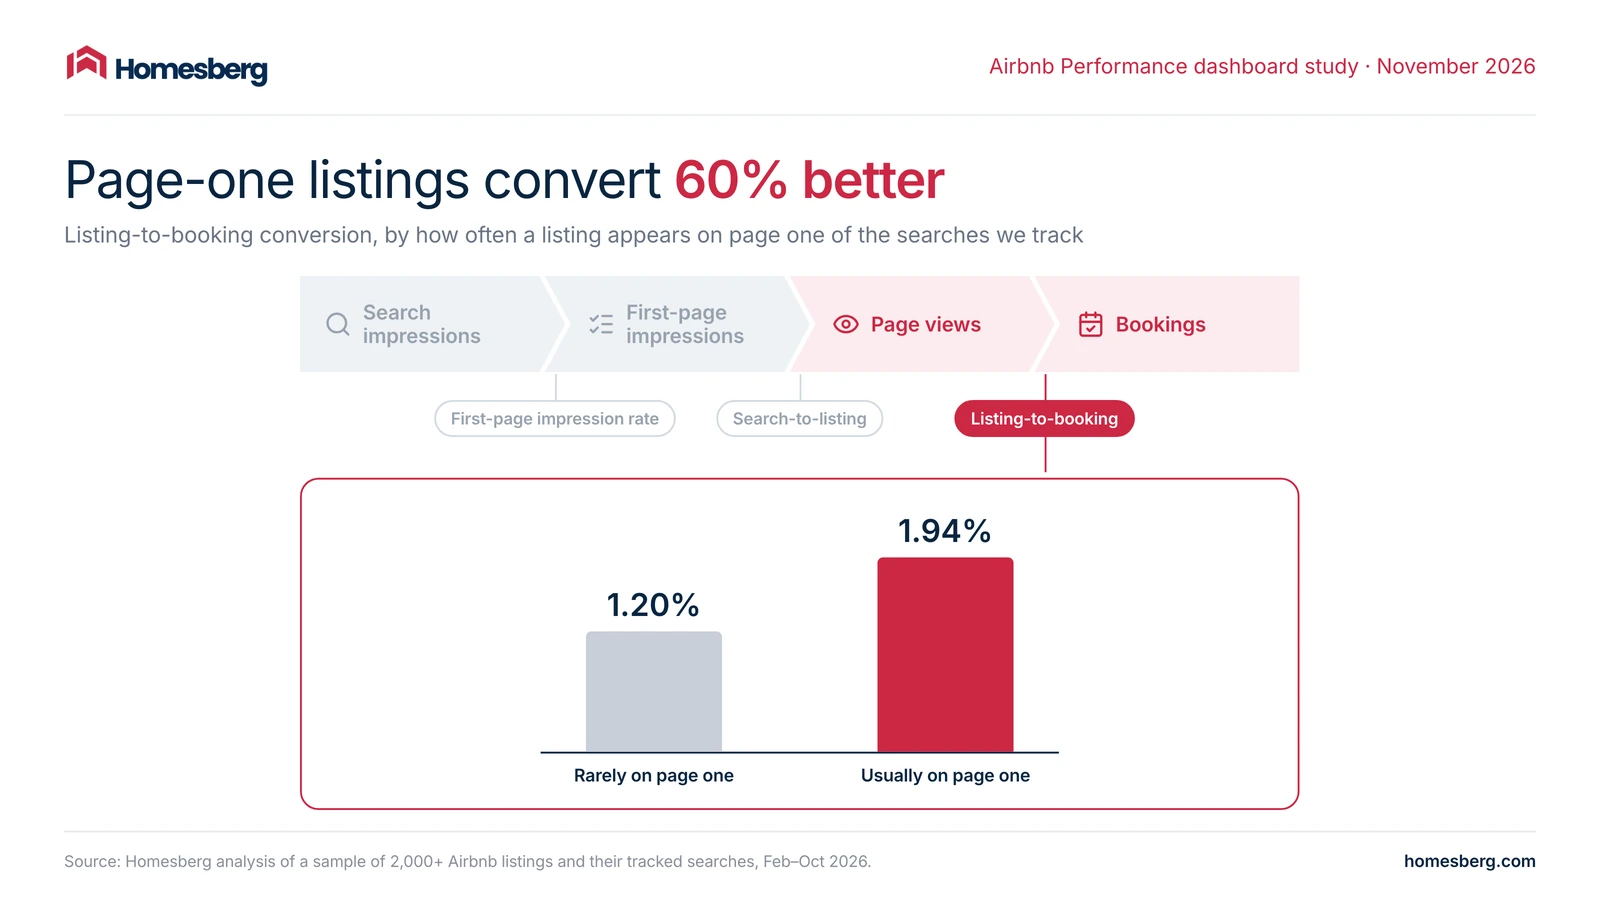
Listings that usually sit on page one convert page views about 60% better than listings that rarely get there (1.94% against 1.20%). It is tempting to read that as page one making guests more likely to book. The same-listing data says otherwise.
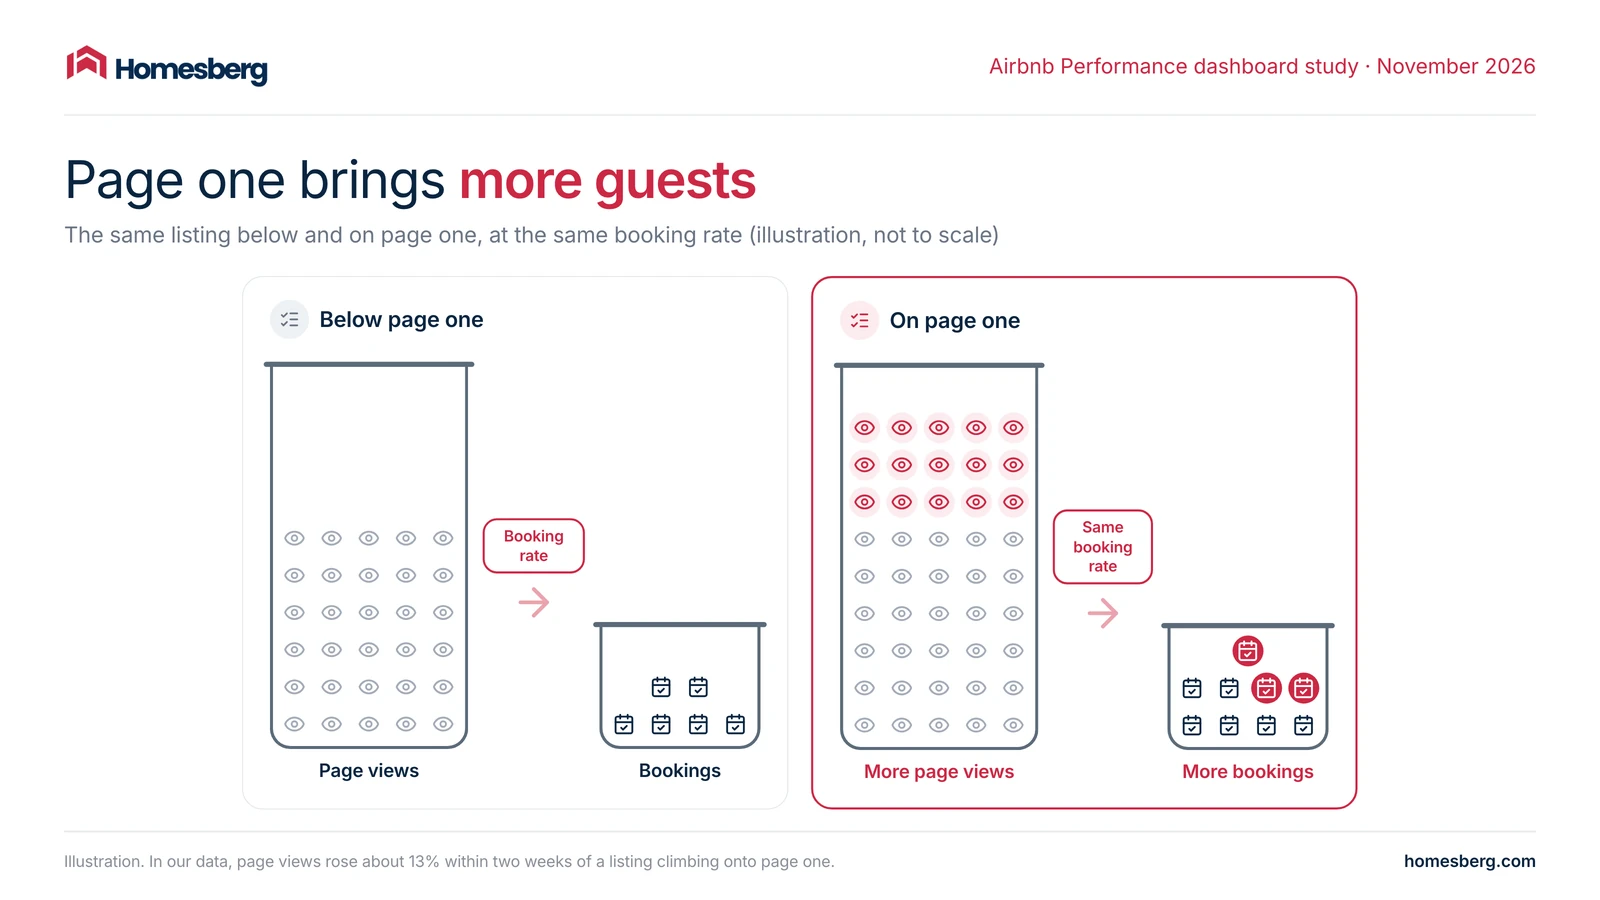
Using the same method as for price, we tracked how often each listing appeared on page one of the searches we monitor for it every day. When a listing climbed onto page one, its page views rose about 13% within two weeks, and its guests kept booking at the listing’s usual rate.
So the gap comes from the other direction. Airbnb ranks listings partly on how likely they are to be booked, so a strong conversion rate helps earn page one, and page one brings more guests. Those extra guests book at your usual rate, which means more bookings, not a higher percentage.
Does page one bring bookings? Yes. When a listing moved onto page one for a search, the dates guests were searching for were booked within two weeks 31% of the time, against 25% in comparable searches where the listing stayed below (same starting rank, price change and days to check-in). That is about a quarter more often. Even in our strictest test, comparing each listing only with itself, those dates were about 8% more likely to be booked. Price is the fastest way onto page one, as the next section shows. For the other levers, see our guide on how to rank higher on Airbnb.
Price, Rank and Conversion: What Each One Controls
A lower price lifts your rank, a higher rank brings more guests, and more guests bring more bookings. Here is how strong each link is in our data.
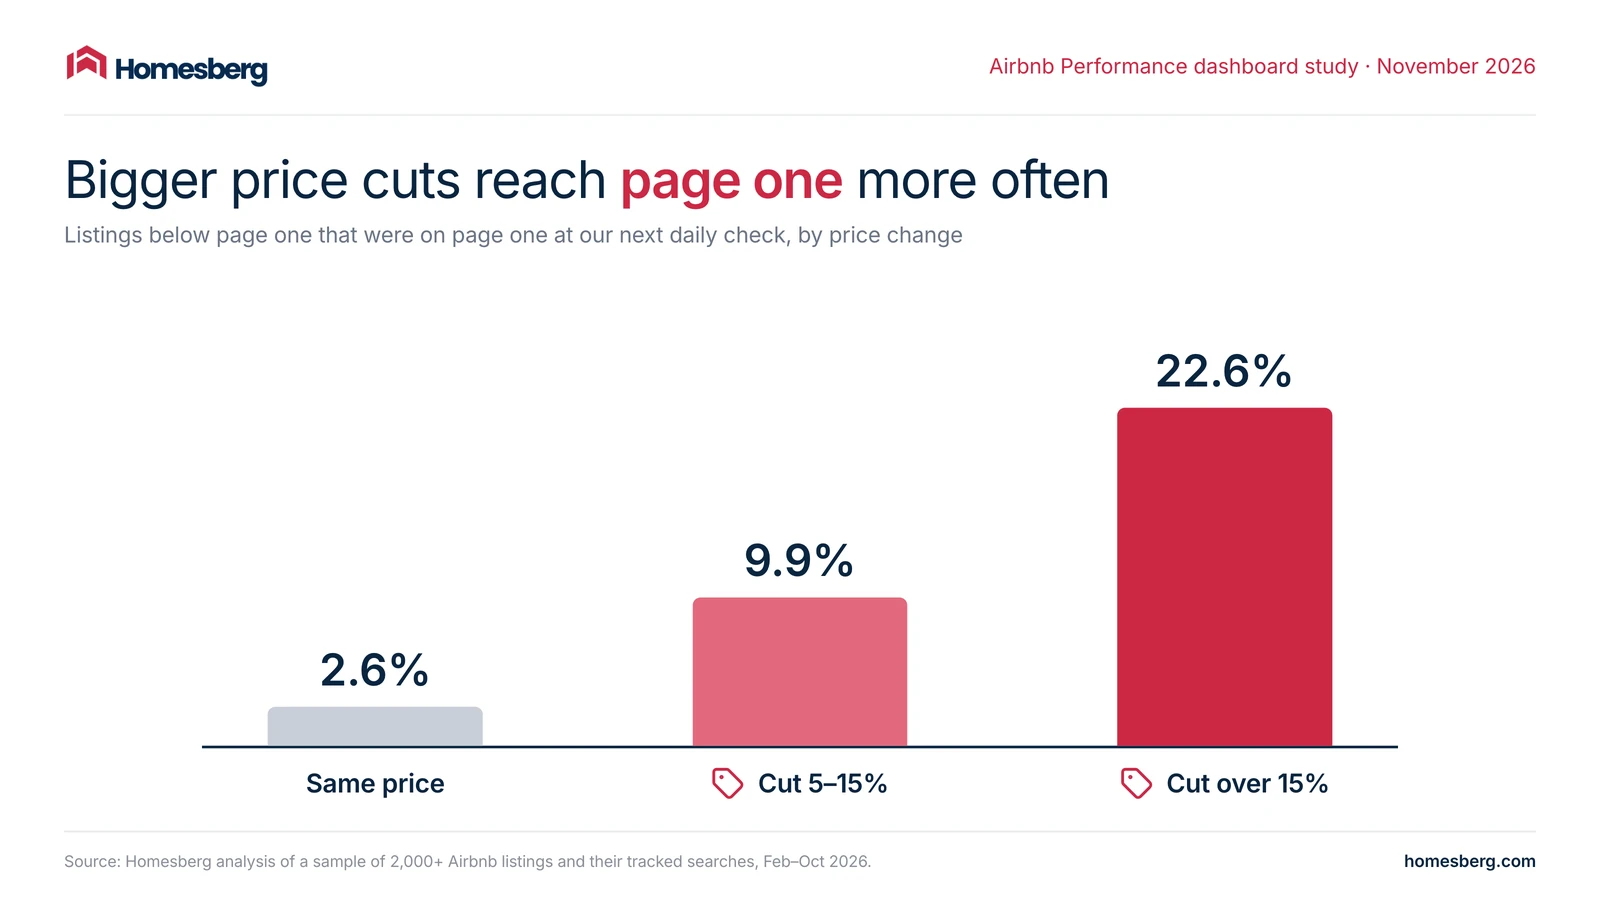
1. Price moves rank. We check each tracked search once a day. A listing below page one that cut its price by more than 15% was on page one by the next check 22.6% of the time, against 2.6% when the price stayed the same. That is about 9 times as often. Smaller cuts work too, just less: 9.9% after a cut of 5–15%. The same holds in reverse: a rise of more than 15% knocked a listing off page one in 29.6% of cases, against 6.5% with no change.
2. Rank moves demand, and demand moves bookings. As the last two sections showed, page one brings about 13% more page views, the share of guests who book holds steady, and so more of them book. That leaves a simple rule:
- Price and rank control the top of the funnel: impressions, page views and wishlist saves.
- Your listing page controls the bottom: the share of visitors who book.
That is the idea behind dynamic pricing that watches your search position: set the price that gets your listing seen, then let a strong listing page turn the extra traffic into bookings. Want to see where your own listing shows up right now? Check it with our free Airbnb rank checker.
The bottom line: fix traffic problems with price and rank, and fix conversion problems on the listing page. Mixing the two up means fixing the wrong thing.
Last 7 Days vs Next 30/90 Days: Which Window to Watch
In the mobile app, the Conversion tab gives you seven windows. Past windows (Last 7, 30 and 365 days) show what guests did. Upcoming windows (Next 7, 30, 90 and 180 days) show demand for your future dates. On desktop, you pick a date range instead, and each page compares it with the previous period of the same length.
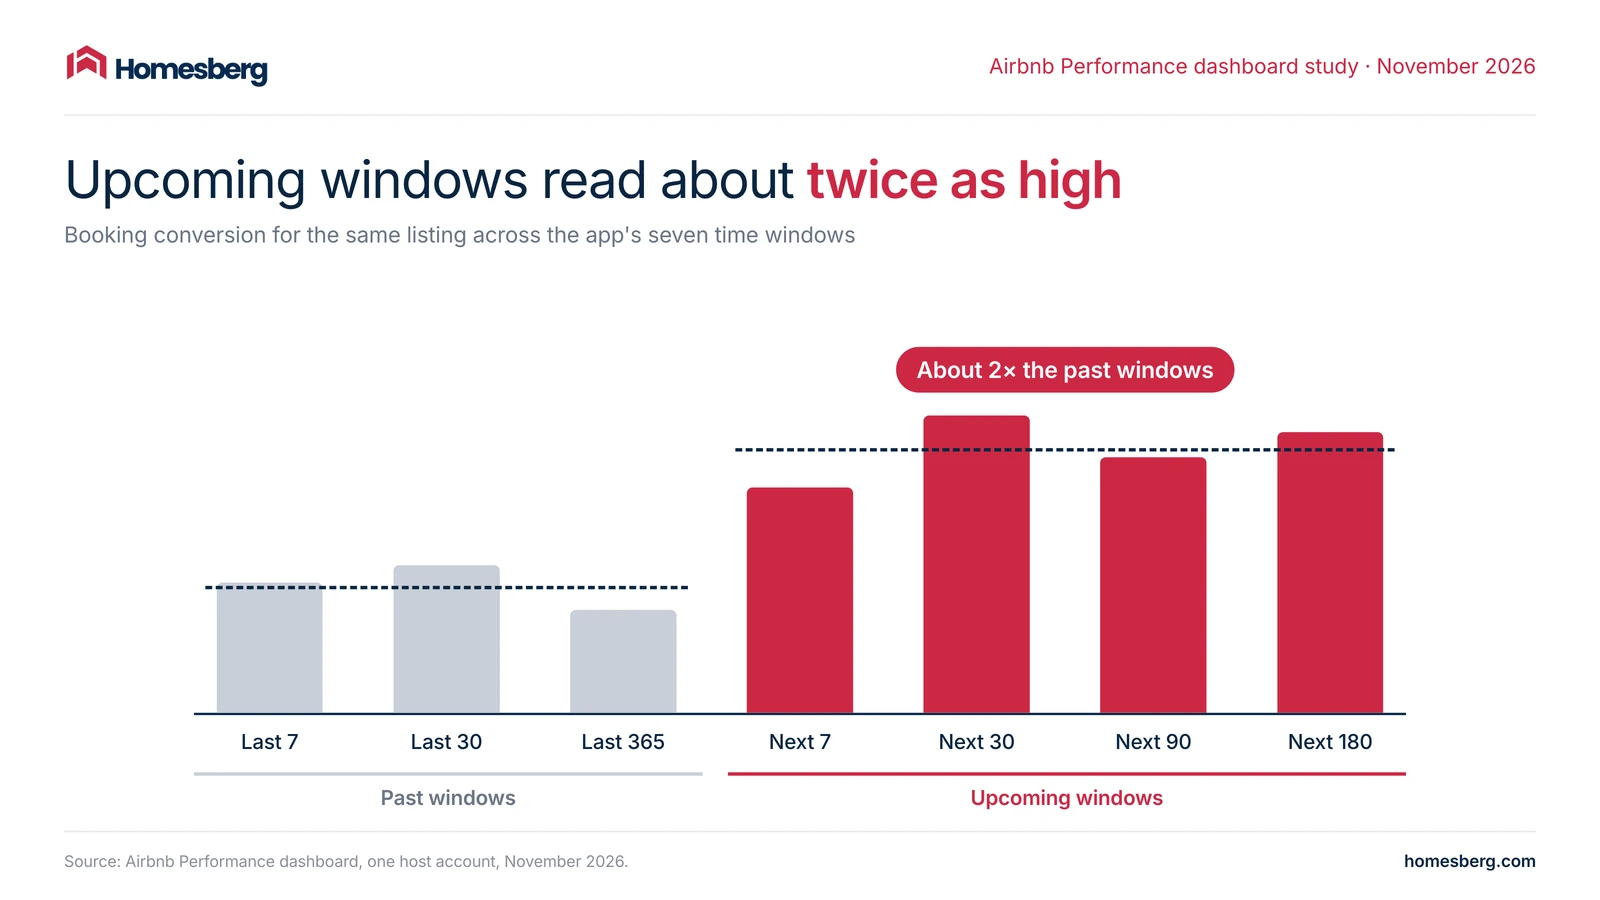
In the example above, the same listing reads 0.37–0.53% in the past windows and 0.81–1.07% in the upcoming ones. Neither is wrong; they count different things. In our data, the next-90-day figure tracks the nights already booked for those dates, not just last week’s bookings, so it behaves partly like occupancy.
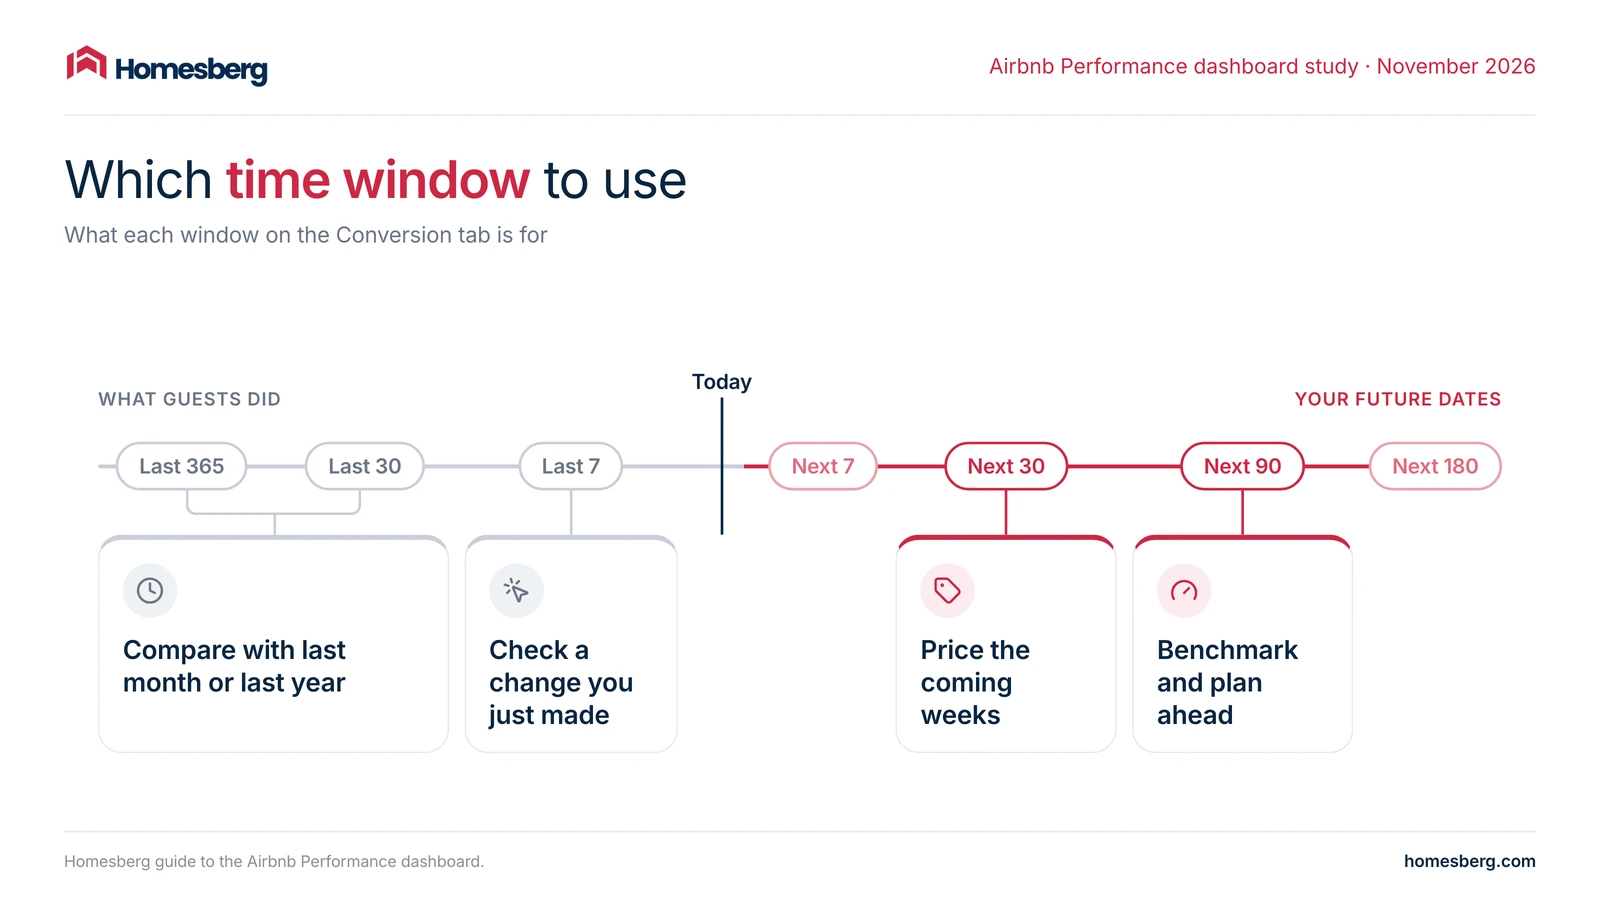
Here is what a change in each window usually means:
- Last 7 days dips, but Last 30 days holds: it was a slow week. There is nothing to fix yet.
- Last 7 days rises right after a change: the change is working. Watch it for another week or two before you call it.
- Next 30 days drops: fewer of the guests looking at the coming weeks are booking. Check your prices for those dates against similar listings.
- Next 90 days drops while views hold: the coming months are filling slowly. Adjust prices and minimum stays for those dates before they arrive.
Compare each window with itself over time. A Next 90 days number and a Last 7 days number are not comparable.
What to Do When Your Airbnb Conversion Rate Drops
Work through this order before you change anything. It takes five minutes and stops you fixing the wrong thing.
- Check the window. Is it one slow week, or does Last 30 days show it too?
- Check the market. Did similar listings drop as well?
- Find the step. Did search-to-listing fall, or listing-to-booking?
- Check the volume. If page views rose while the rate fell, more guests are looking at your listing. That is often good news.
- Fix one thing, then wait a week. If you change price, photos and title on the same day, you will not know which change worked.
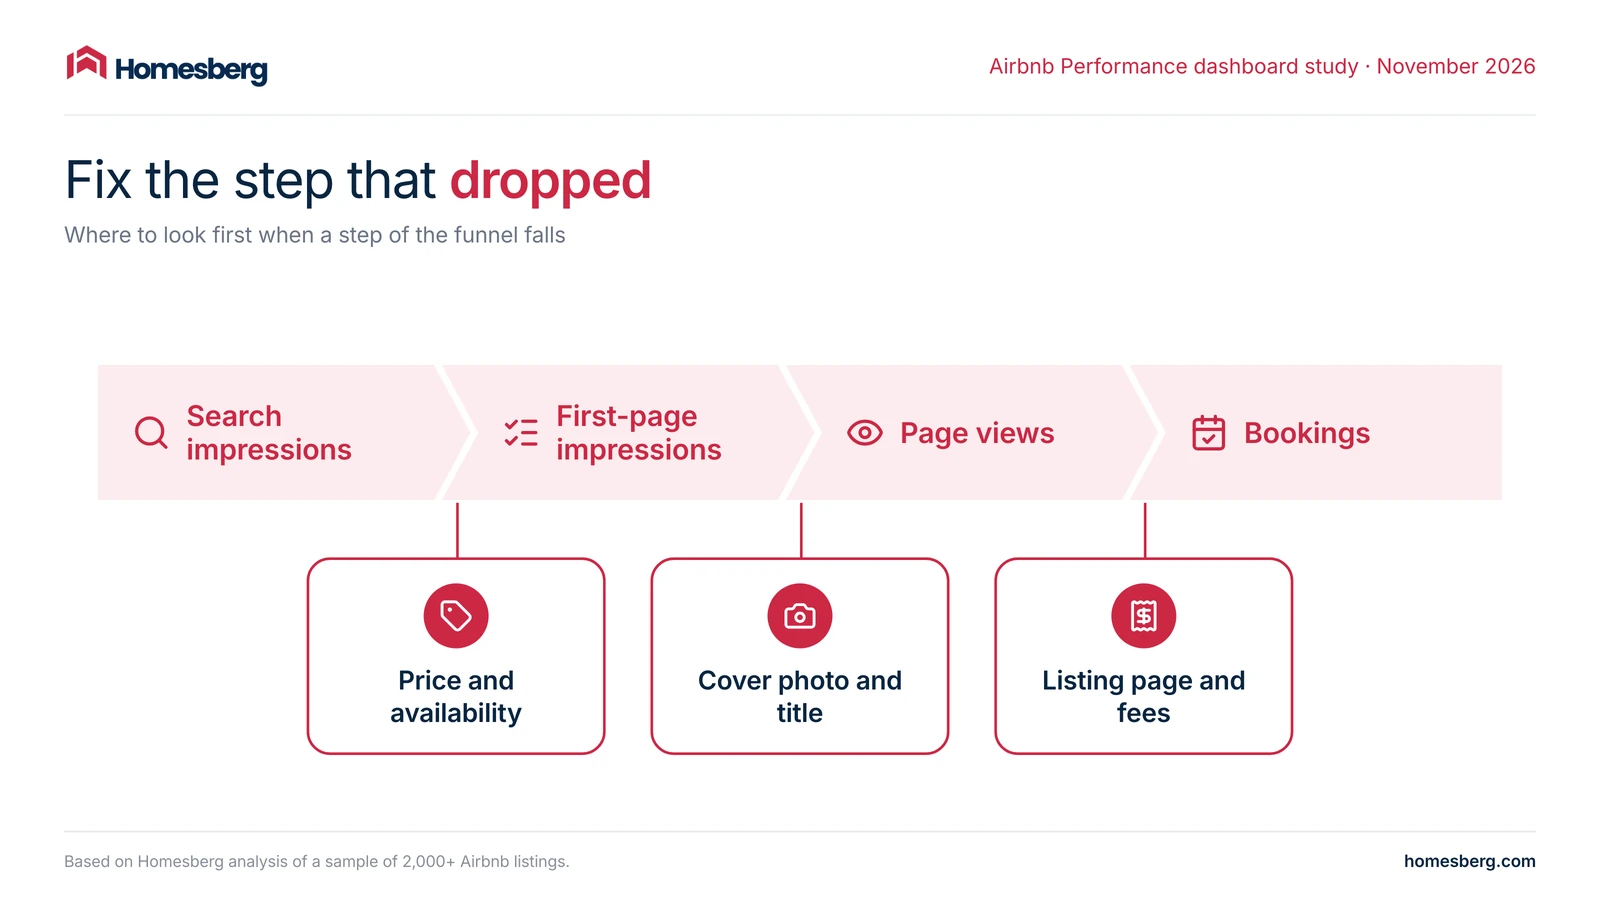
Each metric’s section above lists what to check once you know which step dropped. For a full set of tactics, see our guide on how to get more bookings on Airbnb.
Frequently Asked Questions
What is a good booking conversion rate on Airbnb?
Across our sample of more than 2,000 active listings, the median booking conversion was 0.36%, and the top quarter converted 0.74% or more. The median listing-to-booking conversion was 1.6%. Rates vary by market and season, so compare against your own history in the same time window.
Does lowering my price raise my Airbnb conversion rate?
Not the rate itself, but that is fine. After a listing cut its price by more than 10%, its page views rose about 13% within two weeks and its wishlist saves by about a third, while its conversion rates stayed at their usual level. The same share of more guests means more bookings. A lower price brings more guests to your listing; your listing page decides what share of them book.
Why does my Airbnb get views but no bookings?
Views without bookings point to low listing-to-booking conversion. Guests are interested enough to click, but something on the page stops them. Check the total price including fees, the photos beyond the cover image, recent reviews, and whether the description answers the questions guests ask most.
How do I see insights on Airbnb?
In the Airbnb app or on desktop, tap Switch to hosting, open the menu and select Insights. That opens the Performance dashboard. From there, tap Conversion to see booking conversion, views and wishlist additions for each time window. On desktop, the Booking conversion page also breaks the rate into search-to-listing and listing-to-booking conversion.
How often does the Airbnb Performance dashboard update?
Not in real time. In our data, the “last updated” date was one day behind in 82% of daily snapshots, and at most six days behind. Give a change a few days to show up before you judge it.