Is Airbnb Profitable in 2026? What Hosts Should Expect

The Honest Answer: Profitable, but Not Automatically
Airbnb’s most recent financials were strong: revenue, gross booking value, and nights booked all grew meaningfully year-over-year, and the company has positioned 2026 as a year of continued acceleration. From the platform’s perspective, the story is straightforward: more travel demand, more nights booked, higher Average Daily Rates.
The story for individual hosts is considerably more complicated.
The same market can produce a host earning several times more than another host down the road with a similar property. The difference is not luck. It is a combination of market selection, pricing discipline, and search visibility that most new hosts underestimate when they first run the numbers.
This post unpacks what profitability actually looks like in 2026, using real income ranges, a clear view of the cost structure, and the variables that determine which side of the gap you end up on.
What Hosts Are Actually Earning: Income by Property Type
Widely cited “average host income” figures are technically accurate but nearly useless for planning purposes, because they average full-time operators with hosts who rent a spare bedroom three weekends a year.
Here is what the data shows when broken down by property type.
Entire home listings
Entire-home listings generate the highest revenue per listing and the widest range of outcomes. Gross annual revenue varies significantly by market, property size, and how actively the listing is managed. After accounting for operating expenses (cleaning, platform fees, insurance, utilities, supplies), net income can range from modest to substantial depending on all of those factors. Hosts in top-tier markets with active pricing strategies consistently outperform those in weaker markets or those running static rates.
Private room listings
Private rooms offer a lower-risk entry point. You are renting a bedroom in your primary residence, so your fixed costs do not change much. Revenue is lower, but so is the management overhead.
Net income is lower than entire-home listings, but so is the management overhead. One underappreciated advantage: because nightly rates are lower, occupancy tends to be more stable across seasons. Price-sensitive travelers book year-round, which reduces the dramatic seasonal swings that entire-home hosts deal with.
The rental arbitrage exception
Rental arbitrage (leasing a property and listing it on Airbnb) narrows the margin considerably. The monthly lease payment replaces the mortgage as your primary fixed cost, which works well when the gross revenue covers it comfortably and falls apart when occupancy dips.
In 2026, the arbitrage model remains viable in a select number of markets. Most analysts point to only a handful of cities where monthly margins after all expenses stay consistently positive. In many popular markets, the model generates losses once all expenses are accounted for. Market selection is not a detail here. It is the decision.
The Profitability Equation: Three Variables That Determine Your Outcome
Three inputs drive virtually all of your revenue outcome. Most hosts focus on only two.
Most profitability discussions reduce the problem to two variables: nightly rate and occupancy. That framing is incomplete. In practice, a third variable gates both of them.
Search visibility determines how many potential guests ever see your listing. A property priced correctly at the right occupancy target cannot book if it is buried on page four of Airbnb search results. This is a pattern that shows up consistently when you compare professionally managed listings against casual ones: the managed listings do not just price better, they rank higher, which produces more impressions, which translates into more bookings at the rates they set.
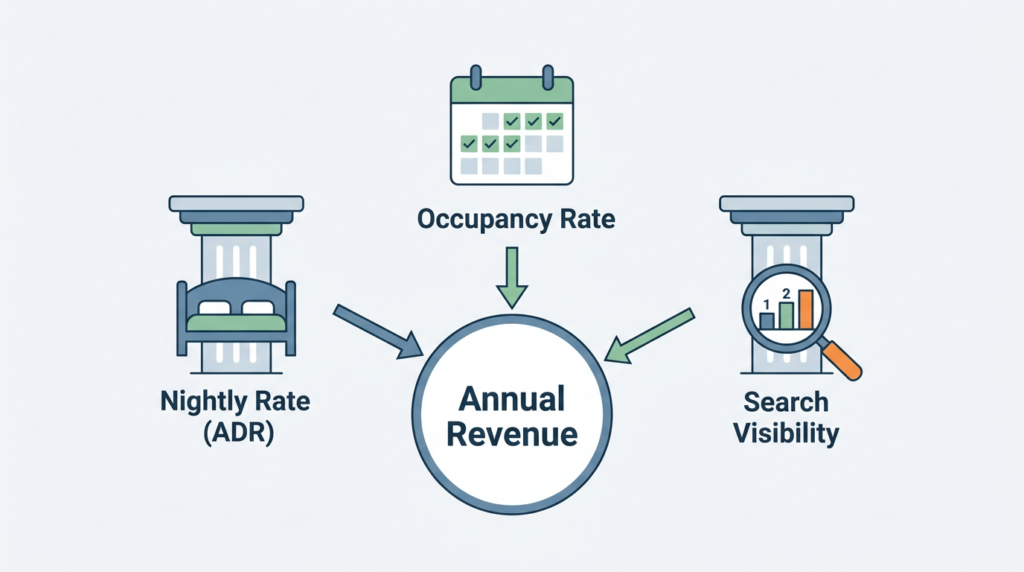
The profitability equation looks like this:
Annual Revenue = (Nightly Rate) × (Occupancy Rate) × (Search Visibility)
Where search visibility functions as a multiplier on the other two. Price accurately but rank poorly, and the revenue ceiling is lower than your market would otherwise support.
What the numbers show across markets
Key point: Several guides and industry datasets converge on the same finding: top-quartile hosts consistently outperform bottom-quartile hosts in the same city by a wide margin, and the primary differentiator is not the property itself, it is pricing strategy and search positioning.
Revenue outcomes vary significantly by market. Beach and mountain leisure destinations tend to produce higher gross revenue but more concentrated seasonal demand. Urban markets offer steadier year-round occupancy but often lower nightly rates. Secondary and tertiary destinations can outperform primary markets on a net basis if competition is lower and operating costs are manageable. Subtract operating expenses (which typically consume a meaningful share of gross revenue) to reach net profit for any market projection.
What Actually Eats Your Margin: The Real Cost Structure
New hosts almost universally underestimate operating costs. The most common error is projecting income based on gross revenue without building a complete expense picture.

A well-presented property is a prerequisite for competitive occupancy. But the costs behind the scenes determine whether that occupancy translates to profit.
Here are the cost categories that matter most.
Startup costs
Before accepting your first booking, expect meaningful upfront investment. This includes furnishing (the largest single upfront item), professional photography, smart home equipment, and initial supplies. The total varies widely by property size and quality level, but it is rarely negligible.
Ongoing monthly expenses
For a typical entire-home listing, the recurring cost structure looks roughly like this:
- Cleaning: Cost per turnover adds up quickly at meaningful occupancy rates. This is the line item most underestimated at the start.
- Utilities: Guests consume more electricity and water than a typical household, which shows in the bills.
- Airbnb host fee: A percentage of each booking’s revenue, deducted automatically.
- Insurance: Proper short-term rental coverage is more expensive than standard homeowner’s policies, which typically exclude STR activity entirely.
- Maintenance reserve: A recurring annual allocation based on property value.
- Software: Property management systems, dynamic pricing tools, and channel managers each carry monthly per-listing fees.
Taxes and compliance
Occupancy tax rates vary significantly by jurisdiction. Business license fees and short-term rental permits add an additional layer of cost in most markets. Some cities require registration with local government registries, which adds an administrative burden on top of the financial one.
The bottom line on costs: total expenses typically consume a substantial share of gross revenue. This is the figure that makes or breaks a business case, and it is the one most prospective hosts fail to model accurately.
Where Pricing Strategy Creates the Gap
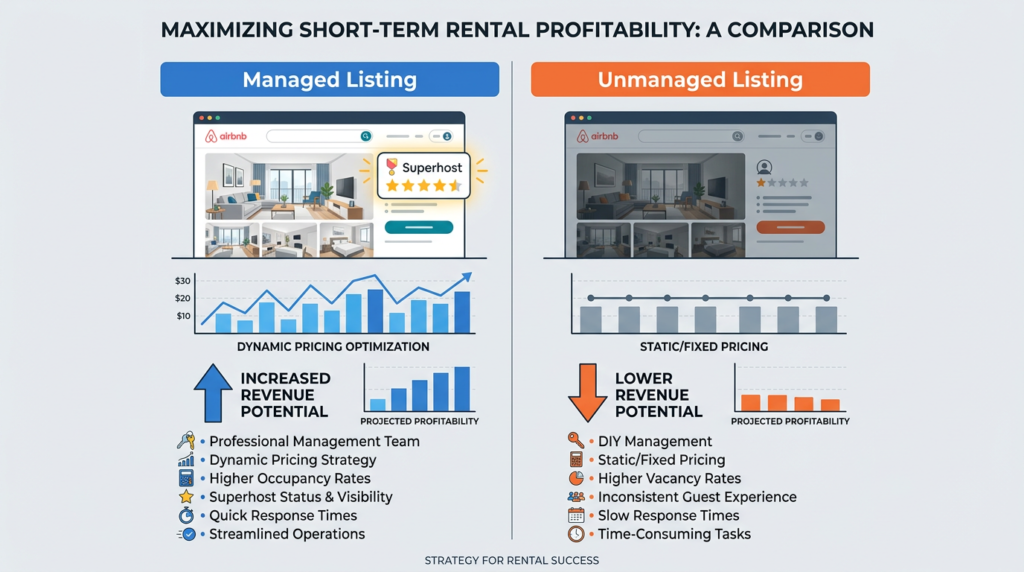
Professionally managed listings in the same market consistently outperform individually managed ones. Pricing strategy, not property quality, accounts for most of the gap.
In market after market, professionally managed listings consistently outperform individually managed ones in the same area by a significant margin. The gap is not explained by property quality or location. It is explained by pricing strategy and how that strategy interacts with search position.
Static pricing (setting one rate and leaving it) leaves money on the table in two directions simultaneously: you undercharge during high-demand periods (events, holidays, weekend spikes) and you hold rates too high during slow periods when a modest reduction would fill the gap.
Key point: Hosts using dynamic pricing tools consistently earn more than those using flat rates in comparable markets, according to multiple industry analyses. The tools adjust rates based on local demand, competitor pricing, day-of-week patterns, and booking lead time, often making multiple changes per day.
What the more sophisticated tools also factor in is a variable that standard dynamic pricing often ignores: where your listing appears in Airbnb search results. Your nightly rate and your search ranking are not independent. Airbnb’s algorithm uses pricing competitiveness as one input into how it positions your listing relative to comparable properties. A rate that is too high relative to market conditions reduces your search visibility, which reduces impressions, which reduces bookings, even if your absolute rate would have been reasonable in isolation.
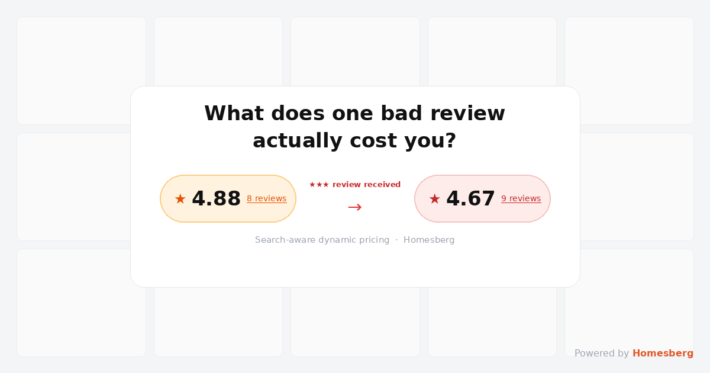
This is where search-aware dynamic pricing becomes a meaningfully different approach from conventional revenue management. Rather than optimizing for ADR alone, it treats search position as a variable to manage alongside nightly rate, occupancy, and revenue. Homesberg’s pricing tool is built around this logic, connecting pricing decisions to actual ranking data so that rate adjustments account for their effect on where the listing appears in search, not just what it charges when a guest lands on the page.
What Has Changed in 2026
Several things have shifted since the years when most of the “Airbnb income” playbooks were written.
The platform is more competitive
Airbnb removed a significant number of low-quality listings in 2025 and has been pushing hosts toward better guest experiences, flexible booking policies, and more competitive pricing. This raises the floor for what a listing needs to do to maintain strong search placement. A listing that would have ranked well in 2022 on the strength of good photos and a decent location may need active pricing management and a strong review record to maintain the same position today.
Market maturation has bifurcated outcomes
Industry data characterizes 2026 as one of the stronger years for short-term rental investment since 2021, but that optimism is market-specific. Some metros show clear saturation signals. Others, particularly in secondary and tertiary destinations, still offer meaningful upside for well-positioned hosts.
The saturation pattern matters because it affects the profitability calculation at both ends: lower occupancy in oversupplied markets compresses gross revenue, while higher competition forces pricing discipline to avoid ranking drops.
Regulation continues to tighten
Cities worldwide are imposing stricter rules on short-term rentals. Owner-occupancy requirements, rental-day caps, and permit registration systems are now common in major markets. A property restricted to 60 nights per year generates a fundamentally different revenue profile than one with unlimited availability.
Before committing to a market or property, understanding the local regulatory environment is not optional. It is a prerequisite for building a realistic financial model.
Is It Still Worth It?
The honest answer is: it depends on what you are comparing it to, and how you intend to operate it.
Short-term rental income consistently outperforms long-term rental income on the same property in markets with strong tourism demand. The revenue gap is meaningful, even after accounting for higher operating costs on the STR side.
The comparison looks different in markets with weak demand, tight regulation, or when you are not willing to invest in the management side of the business. A long-term rental with a reliable tenant and minimal overhead will outperform a poorly managed Airbnb listing almost every time.
What the data across multiple sources consistently shows is this: the profitability gap is not primarily about the property, it is about how the listing is managed. Market selection, pricing strategy, search positioning, and guest experience account for the vast majority of the variance between a struggling host and a high-performing one running a similar property type in a similar price range.
That gap is where the leverage is in 2026.
How to Benchmark Your Own Listing
If you are already hosting, a few concrete benchmarks help you assess where you stand.
- Occupancy rate. Compare your occupancy against comparable listings in your market. If you are consistently trailing, the likely culprits are pricing, listing quality, or search position, not the market itself.
- Review score. Listings with higher ratings earn more per booking and rank better in search. The gap between a strong and a weak review profile compounds over time.
- Superhost status. Superhosts consistently outperform non-Superhosts in revenue. Requirements include a high overall rating, low cancellation rate, strong response rate, and a minimum number of stays per year.
- Revenue per available night (RevPAN). Divide your annual gross revenue by the number of nights the property was available. Compare against your market average. If you are significantly below market, the problem is almost always occupancy, pricing, or both.
If you want to benchmark against your own market specifically, Homesberg’s market data tools let you view regional metrics, including average nightly rates, occupancy trends, and competitor positioning for your area. Once you sign up and enable the ranking feature, you can also see exactly where your listing appears in Airbnb search results for any date range and filter combination — which turns the benchmarks above from abstract numbers into something you can act on directly. You can get started at homesberg.com.
Conclusion
Airbnb is profitable in 2026. But “profitable” is doing a lot of work in that sentence.
The platform’s strong headline growth tells you about demand. It does not tell you what your specific listing will earn, what your expenses will be, or whether the numbers work given your local regulations and cost structure.
What the numbers do show clearly is that the distance between a well-operated listing and a casually managed one has grown. The easy era of setting a rate, uploading some photos, and watching bookings arrive is over in most markets. Profitability in 2026 is the result of deliberate choices: market selection, accurate expense modeling, pricing strategy that accounts for search position, and consistent guest experience.
Those choices are available to any host who takes the business seriously. The gap they create is real, and it is replicable.
Want to see where your listing actually stands in your market? Sign up on Homesberg, enable the ranking tracker, and view your area’s metrics alongside your listing’s live search position.
This post is informational and reflects publicly available data and desk research as of early 2026. Revenue figures vary significantly by market, property type, and operational approach. Individual results will differ. Consult a qualified financial adviser or accountant before making investment decisions.